Tech
What is Geospatial Data? Types, Python code, Analytics & Visualization
Welcome to my blog, where we explore the fascinating world of geospatial data!
Have you ever wondered how analysts use Python to make sense of complex geographical datasets for visualizing and predicting trends in analytics? In this blog, I’ll break down the different types of geospatial data, discuss the advantages and disadvantages of using each type, and show you how Python can be used to make data analysis a breeze. So let’s get started on our journey through the world.
Geospatial data is time-based data related to a specific location on the Earth’s surface. It can provide insights into relationships between variables and reveal patterns and trends.
.jpg)
Introduction to Geospatial Data
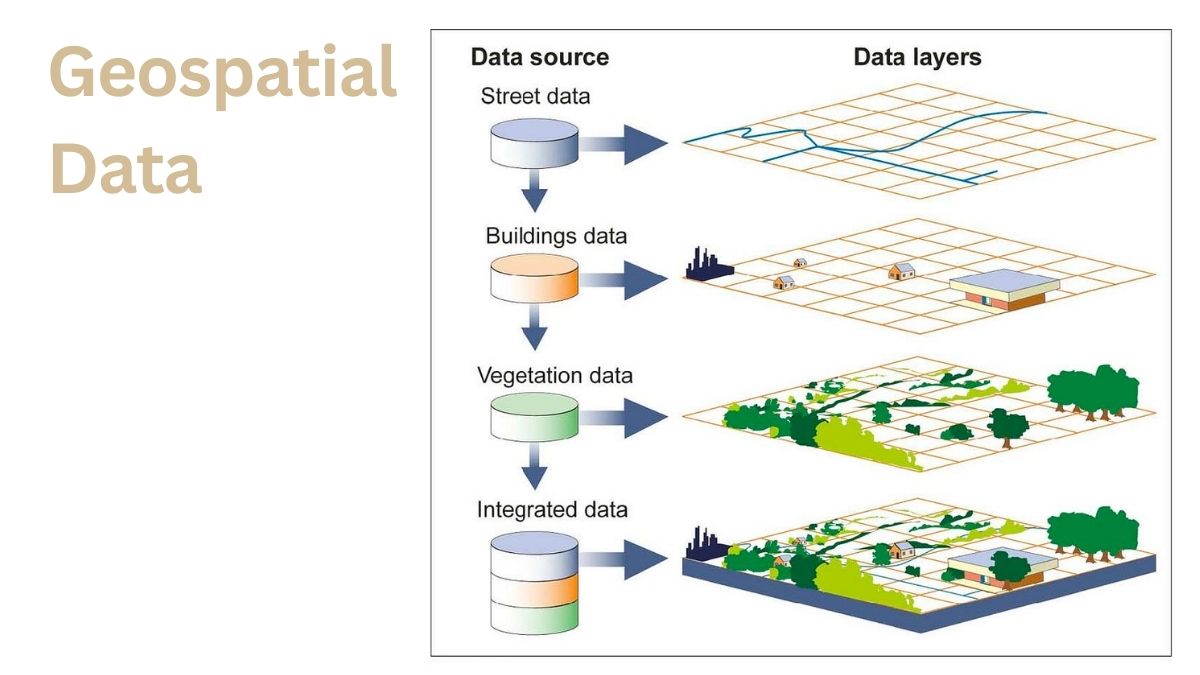
Geospatial data is information that is tied to a specific location on the Earth. It can be used to represent things like roads, buildings, and geographical features like mountains and rivers. This data is often shown on maps, and it can be used for a variety of purposes, such as helping people find their way around a city, understanding the layout of a region, and studying how different parts of the Earth are connected and interact with each other. Geospatial data is collected using tools like satellites, GPS devices, and aerial photographs, and it is often stored in computer systems that can help us analyze and understand it in more detail.
Geospatial data, also known as geographic data, refers to any data with a location element. It is usually associated with mapping data and can be used to create maps or analyze geographic trends. Geospatial data includes geography and spatial analysis aspects such as coordinates, elevation and shapefiles.
Python is a popular language for working with geospatial data due to its libraries such as GeoPandas, Shapely, and Fiona. With these tools, users can read in existing geospatial datasets in various formats such as GeoJSON, KML and ESRI shapefiles. Users can also create new geospatial datasets from scratch using powerful Python tools such as geopandas.
Analytics of these datasets typically takes the form of calculating distances between different geographic entities such as cities or points on the earth surface or finding nearest neighbors for a given point. Visualization of this information is one of the key tasks for understanding any trends or patterns in the spatial dataset being examined. Common types of visualization include choropleth maps that display boundaries filled with color gradients based on certain attributes associated with those boundaries (such as population density).
In summary, Geospatial Data encompasses location-based information that can be analyzed and visualized to gain insight into any trends or patterns present within its related area. Python provides powerful resources for working with spatial information that make its manipulation relatively easy while analytics and visualization provide the best way to understand results derived from those manipulations.
Types of Geospatial Data
Geospatial data refers to any data that has an associated geographic or spatial element, including points, lines and polygons. This type of location-based information is created by combining geographical information systems (GIS), remote sensing, and global positioning systems (GPS). Geospatial data may be collected from a variety of sources, including both digital and non-digital sources, such as aerial imagery, GPS receivers and surveyors.
Examples of geospatial data include:
- Point data: This type of geospatial data contains information about a specific point in the 3D space, such as the exact location of a tree or an airplane. It’s commonly stored in vector files with simple X, Y coordinates to represent the points on a map.
- Line data: This type of geospatial data consists of a set of points connected by straight or curved lines. It’s typically used to show linear features such as roads or rivers in GIS mapping projects.
- Polygonal/Area data: This type of geospatial information describes geographical areas with boundaries that are represented by adjacent polygonal shapes. It’s often used to represent land parcels such as tracts or counties when creating GIS maps.
Geospatial analytics enable organizations collecting and using this type of location-based information to gain insights from their datasets through processing techniques like machine learning algorithms and advanced visualization tools for two dimensional (2D) or three dimensional (3D) output. Python libraries are also widely used for programming related to geospatial analysis tasks because they provide dedicated packages for working with GIS datasets like GeoPandas and Rasterio modules.
Geospatial Data in Python
Python is a popular language for data science and Machine Learning, and it has gained immense popularity due to its flexibility, scalability, and robust set of libraries. One of the most significant advantages of Python is its use in geospatial data processing. Geospatial data (GIS) is a term that describes information about geographical features. This data can be used for a variety of applications, from aerospace engineering to urban planning.
Geospatial data in Python makes use of specific libraries built specifically for processing, analyzing, and visualizing GIS datasets. Some popular tools used for geospatial analysis in Python are GeoPandas, geopandasGF (which builds on geopandas), PySAL, Folium, PyQGIS (the official library for interacting with QGIS), Shapely, PyProj and more. These tools provide powerful mapping capabilities that allow users to integrate existing GIS datasets with their own analysis tools into user-friendly web or desktop applications.
Geospatial analytics in Python includes working with both vector and raster data – such as geometries like points, lines, polygons , or pixels generated from aerial imagery – often further probed through linear regression algorithms such as Ordinary Least Squares or variograms born out of interpolation methods like Kriging . Integrating these analytical approaches with other types of statistical modelling can provide insights into new types of problems which cannot be solved by traditional GIS approaches alone.
Other important topics include cartographic visualization techniques – ranging from basic plotting libraries up to crafting complex geographic charts – as well as pattern recognition through kernel density estimations or building spatially-constrained models with the help of spatial autocorrelation functions . All these topics require detailed knowledge about the underlying concepts that drive the respective task at hand. However due to their direct application into ‘real world’ problems they might prove invaluable for solving problems at hand with an added spatial element attached
Geospatial Analytics is a Trend
Geospatial data, or geographic information systems (GIS) data, are the foundation of geospatial analysis. This type of data includes digitized maps, aerial photos and satellite imagery that provide geographical information about a particular area. It also includes other types of non-spatial data such as address points, relationships between features and metadata.
Geospatial Analytics is the process of using GIS data to generate insights into a particular area. It is an important tool for decision makers in a variety of fields including urban planning, public health and business analytics. In Geospatial Analytics, the GIS data is analyzed to uncover trends and patterns in the area being studied. The findings from geospatial analysis can then be used to create more efficient solutions for businesses or guide policy decisions for government agencies.
Geospatial analytics uses advanced software such as Python in conjunction with specialized libraries like geopandas to blend GIS datasets and perform powerful spatial analysis. This software makes it easy to visualize complex trends within GIS datasets with interactive maps, graphs and charts. Data can be further explored with advanced analytics techniques like machine learning to predict future outcomes for areas being studied. With geospatial analysis, professionals have better tools than ever before to solve big problems using accurate geographic information systems data.
Geospatial Visualization in 2023
Geospatial visualization is an important tool for analyzing and interpreting data related to a geographic area. This method of data analysis involves using software programs like Python, analytics, and visualization tools to construct detailed visuals of the physical characteristics within a given region. By creating digital maps, researchers can gain insight into the patterns of population density, land use, environmental features, natural resources, and other data parameters in an area. By leveraging such information within industry sectors such as agriculture, transportation & logistics, healthcare services, manufacturing operations – businesses can better plan for future operations with accurate insights into their surrounding environments.
Using geospatial visualization allows stakeholders to examine different types of data on a granular level such as weather disturbances, disease outbreaks among agricultural products or asset management. With this approach it is possible to represent fields in subtle color gradations against other features that may lend understanding towards more acutely targeted explanations. Visualizing geospatial data also enables researchers to identify key patterns and correlations between geographic features and targeted progress points across large areas or even worldwide regions.
TOP tools for visualization of your GIS Data
- Kepler.gl
- BatchGeo
- ArcGIS Online
- CARTO
- GRASS GIS
- QGIS
- GeoDa
- Geocodio
Geospatial Data Sources
Geospatial data, also known as geographic information or spatial data, is a highly structured form of data used to represent real-world physical and cultural features on a two- and three-dimensional map. It includes the coordinates of points, lines and areas; attributes about the features; relationships between them; and geometric arrangements for efficient visualization of large data sets.
Use this links to find digital geospatial data sites.
Primary Sources of FREE USGS Geospatial Data
- The National Map – Go to The National Map Download Client to download US Topo and historical topographic maps, and data for the United States for various themes to include:
1) Boundaries;
2) Elevation Products (3DEP);
3) Elevation Source Data (3DEP);
4) Hydrography (NHD) and Watersheds (WBD);
5) Imagery from High Resolution Orthoimagery and National Agriculture Imagery Program;
6) Map Indices;
7) Geographic Names;
8) Land Cover;
9) Structures;
10) Transportation;
11) Woodland.
Contours are under Elevation Products, and lidar point clouds are under Elevation Source Data.- Small-scale data, formerly on The National Atlas, includes Printable Maps, Small-scale Framework data, and Global Map data (1:1,000,000 scale).
- The National Map Services provide a complete list of service endpoints, which contain REST, WMS, WMTS (cached base maps only), WFS, WCS, and other service links.
- Earth Explorer*- Download data from more than 300 data collections that span over 75 years of coverage. Includes USGS satellite imagery, historical and recent USGS aerial photography, elevation data, land cover products, Lidar point cloud data, Digital Line Graphs (DLGs), Digital Orthophoto Quads (DOQs), and much more. How to use Landsat Spectral Bands can be helpful.
- GloVis*- Just looking for satellite imagery? Don’t really need a robust and complex search engine? GloVis is a browse-based viewer that’s easier to search and more user-friendly than EarthExplorer. Products include Landsat, ASTER, EO-1, MODIS, and TerraLook imagery, NAPP and NHAPimagery. How to use Landsat Spectral Bands can be helpful.
Additional FREE Geospatial Data from the USGS & Our Partners
- LandsatLook*-Full-resolution JPEGs of Landsat satellite images that are best used for image selection and simple visual interpretation. Available as thermal or natural color images with optional geographic reference. Not recommended for digital analysis.
- Emergency Response Portal*-Geospatial imagery for national and international disasters.
- Science Data Catalog*-Metadata and links to all USGS data. Search capabilities are somewhat limited due to the size of certain datasets.
- National Geologic Map Database-Search over 90,000 maps and reports, including free digital maps and GIS map data. Primary themes are geology, geophysics, marine, energy resources, and natural hazards.
- Hazards Data Distribution System (HDDS)*-A dynamic online map interface that can be used to view and download USGS datasets for national or international disasters including floods, hurricanes, tsunamis, and earthquakes.
- Water Spatial Data-Maps and GIS data for water related topics such as water use maps and data, watershed boundaries, NHD, streamflow records, and more.
- Quaternary Fault and Fold Database of the United States– Geologic, geomorphic, and geographic information for over 2,000 Quaternary (active in the last 1,600,000 years) faults in the U.S. Download shape files and Google Earth files.
- Mineral Resources On-Line Spatial Data*- A source for regional and global geology, geochemistry, geophysics, and mineral resource maps and data. Includes map services.
- Global Mineral Resource Assessments*- Most of these reports contain GIS data. The USGS is in the process of compiling all the data in a single location, but for now users must review each link.
- Energy Data Finder*- Geospatial data related to oil & gas, coal, geochemistry, and geophysics. This is also a good place to look for base data in international locations (used in global energy assessments).
- Maps of America’s Submerged Lands– A portal to published USGS maps, reports, and digital data that depict the bathymetry, surficial geology, and/or subsurface structure of selected submerged U.S. areas. This is mostly coastal locations, but some lakes are included.
- Coastal & Marine Interactive Map Server– GIS data and metadata for past and current projects.
- Astrogeology MCTR GIS Lab– Graphical, statistical, and spatial GIS tools for analyses of planetary data. All downloads are free. Links to Interactive GIS maps of Mars, the Moon, and Venus.
Geospatial data comes in a variety of forms. Traditional sources include aerial photography, satellite imagery, paper maps and census records. Modern geospatial technologies increasingly use ever larger datasets collected through sensors ranging from GPS systems to mobile phones to automated vehicle Recognition (AVR) systems.
The rise in geospatial technology has drastically increased the availability and sophistication of geospatial datasets from both public sector (e.g., government) sources as well as an exploding number of private sector organizations actively collecting their own location-based commercial data (e.g., web traffic). Consequently, most sectors now rely on geospatial technology solutions including navigation systems, environmental monitoring systems, analytics engines and visualization software applications such as Python’s geopandas library for geographic analytics or QGIS for visualization tasks.
By understanding its sources and capabilities, businesses can leverage the power of geospatial technology to optimize product delivery updates , enable customer targeting programs based on locationarlytics , offer engagement mobile solutions (like Walmart Inc.’s Walmart Pay system), or improve their disaster risk management programs .
Challenges of Working with Geospatial Data
The use of GIS data has become increasingly popular in recent years; it provides a powerful tool for analyzing spatial data related to locations and activities. However, working with large datasets of this type can pose a challenge. Geospatial data often has different formats and fields than other types of information, and some users lack the technical skills or resources required to understand and work with them efficiently.
Python is an excellent programming language for handling geospatial data, as it is designed specifically for manipulating such large amounts of spatial information. Geoprocessing tools available in Python provide an effective means of manipulating geospatial data, enabling the user to format the data correctly, filter it according to different criteria and complete analytics tasks quickly.
Geoanalytics refers to using geospatial technology to create actionable insights from location-based data. Advanced analytics tools can be used to explore patterns within geo-data sets and identify trends across varying spatial dimensions. For instance, businesses can use geo-analytics software to gain insights into customers’ purchasing habits by analyzing location information gathered from sales transactions.
Visualization is also a fundamental part of working with geospatial data. By plotting the results from geo-analytics on a map, users can gain valuable insights into their datasets that would otherwise be difficult or time-consuming to uncover within the raw numbers or text alone. Whether using existing visualization tools such as ArcGIS Story Maps or building custom maps using GeoJSON files, visualizing your results brings your analysis process full circle.
Despite its complexities and differences from other forms of datasets, working with geospatial information can open up new opportunities for businesses when used correctly in combination with analytics and visualization techniques. Understanding the challenges associated with this type of data is key to maximizing its potential benefits for any organization looking maximize results from their location-based studies.
Conclusion
Geospatial data is a specialized type of data representing information related to our planet’s physical locations. It can include variables such as latitude, longitude, terrain elevation, and population density, among many others. These complex datasets are used in activities such as mapping and analytics to analyze different patterns and trends across the world. Geospatial data offer key insights in order to answer complex geographical questions and figure out the best ways to use physical space for a variety of applications.
Python is one of the most popular programming languages for working with geospatial data due to its wide range of tools available for importing, manipulating, and visualizing this type of data. Furthermore, Python’s libraries make it easy to create powerful analytics dashboards or interactive maps with dynamic features. Additionally, geospatial data visualization has become an essential tool for presentations in recent years as it enables communicators to more easily understand patterns in large datasets and key pieces of information when it comes to making decisions related to land management or policy initiatives.
In conclusion, geospatial data is critical for businesses seeking geographic insight into their activities or operations when developing products or making strategic decisions. With the range of open source libraries available that enable easy manipulation of this type of information using Python coding language skillsets have become highly sought after professionals across many industries today.


Top Facebook Apps and Companies

Can Universities detect ChatGPT content? Yes!

Best Conferences like SXSW in 2026-2027
How to Build Own LLM and What Team do You Need in 2026

AI-powered landing page builders

Top 5 Deepnude Free Trial Apps in 2026
Top Facebook Apps and Companies
How to find Best Wix Corvid Developers in 2026
How to Build Own LLM and What Team do You Need in 2026
Best Conferences like SXSW in 2026-2027
-
 App Development2 days ago
Top Facebook Apps and Companies
-
 Web Development2 days ago
How to find Best Wix Corvid Developers in 2026
-
Software Development2 days ago
How to Build Own LLM and What Team do You Need in 2026
-
 Tech Events2 days ago
Best Conferences like SXSW in 2026-2027
-
 Web Development2 days ago
AI-powered landing page builders
-
 Solution Review2 days ago
Can Universities detect ChatGPT content? Yes!