Tag: geofencing
What is Geospatial Data? Types, Python code, Analytics & Visualization
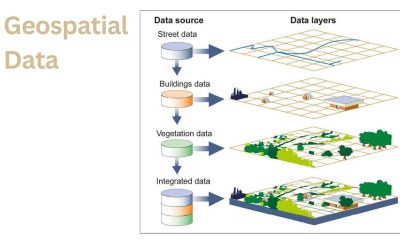
Welcome to my blog, where we explore the fascinating world of geospatial data!
Have you ever wondered how analysts use Python to make sense of complex geographical datasets for visualizing and predicting trends in analytics? In this blog, Iâll break down the different types of geospatial data, discuss the advantages and disadvantages of using each type, and show you how Python can be used to make data analysis a breeze. So letâs get started on our journey through the world.
Geospatial data is time-based data related to a specific location on the Earthâs surface. It can provide insights into relationships between variables and reveal patterns and trends.
Introduction to Geospatial Data
Geospatial data is information that is tied to a specific location on the Earth. It can be used to represent things like roads, buildings, and geographical features like mountains and rivers. This data is often shown on maps, and it can be used for a variety of purposes, such as helping people find their way around a city, understanding the layout of a region, and studying how different parts of the Earth are connected and interact with each other. Geospatial data is collected using tools like satellites, GPS devices, and aerial photographs, and it is often stored in computer systems that can help us analyze and understand it in more detail.
Geospatial data, also known as geographic data, refers to any data with a location element. It is usually associated with mapping data and can be used to create maps or analyze geographic trends. Geospatial data includes geography and spatial analysis aspects such as coordinates, elevation and shapefiles.
Python is a popular language for working with geospatial data due to its libraries such as GeoPandas, Shapely, and Fiona. With these tools, users can read in existing geospatial datasets in various formats such as GeoJSON, KML and ESRI shapefiles. Users can also create new geospatial datasets from scratch using powerful Python tools such as geopandas.
Analytics of these datasets typically takes the form of calculating distances between different geographic entities such as cities or points on the earth surface or finding nearest neighbors for a given point. Visualization of this information is one of the key tasks for understanding any trends or patterns in the spatial dataset being examined. Common types of visualization include choropleth maps that display boundaries filled with color gradients based on certain attributes associated with those boundaries (such as population density).
In summary, Geospatial Data encompasses location-based information that can be analyzed and visualized to gain insight into any trends or patterns present within its related area. Python provides powerful resources for working with spatial information that make its manipulation relatively easy while analytics and visualization provide the best way to understand results derived from those manipulations.
Types of Geospatial Data
Geospatial data refers to any data that has an associated geographic or spatial element, including points, lines and polygons. This type of location-based information is created by combining geographical information systems (GIS), remote sensing, and global positioning systems (GPS). Geospatial data may be collected from a variety of sources, including both digital and non-digital sources, such as aerial imagery, GPS receivers and surveyors.
Examples of geospatial data include:
- Point data: This type of geospatial data contains information about a specific point in the 3D space, such as the exact location of a tree or an airplane. Itâs commonly stored in vector files with simple X, Y coordinates to represent the points on a map.
- Line data: This type of geospatial data consists of a set of points connected by straight or curved lines. Itâs typically used to show linear features such as roads or rivers in GIS mapping projects.
- Polygonal/Area data: This type of geospatial information describes geographical areas with boundaries that are represented by adjacent polygonal shapes. Itâs often used to represent land parcels such as tracts or counties when creating GIS maps.
Geospatial analytics enable organizations collecting and using this type of location-based information to gain insights from their datasets through processing techniques like machine learning algorithms and advanced visualization tools for two dimensional (2D) or three dimensional (3D) output. Python libraries are also widely used for programming related to geospatial analysis tasks because they provide dedicated packages for working with GIS datasets like GeoPandas and Rasterio modules.
Geospatial Data in Python
Python is a popular language for data science and Machine Learning, and it has gained immense popularity due to its flexibility, scalability, and robust set of libraries. One of the most significant advantages of Python is its use in geospatial data processing. Geospatial data (GIS) is a term that describes information about geographical features. This data can be used for a variety of applications, from aerospace engineering to urban planning.
Geospatial data in Python makes use of specific libraries built specifically for processing, analyzing, and visualizing GIS datasets. Some popular tools used for geospatial analysis in Python are GeoPandas, geopandasGF (which builds on geopandas), PySAL, Folium, PyQGIS (the official library for interacting with QGIS), Shapely, PyProj and more. These tools provide powerful mapping capabilities that allow users to integrate existing GIS datasets with their own analysis tools into user-friendly web or desktop applications.
Geospatial analytics in Python includes working with both vector and raster data â such as geometries like points, lines, polygons , or pixels generated from aerial imagery â often further probed through linear regression algorithms such as Ordinary Least Squares or variograms born out of interpolation methods like Kriging . Integrating these analytical approaches with other types of statistical modelling can provide insights into new types of problems which cannot be solved by traditional GIS approaches alone.
Other important topics include cartographic visualization techniques â ranging from basic plotting libraries up to crafting complex geographic charts â as well as pattern recognition through kernel density estimations or building spatially-constrained models with the help of spatial autocorrelation functions . All these topics require detailed knowledge about the underlying concepts that drive the respective task at hand. However due to their direct application into âreal worldâ problems they might prove invaluable for solving problems at hand with an added spatial element attached
Geospatial Analytics is a Trend
Geospatial data, or geographic information systems (GIS) data, are the foundation of geospatial analysis. This type of data includes digitized maps, aerial photos and satellite imagery that provide geographical information about a particular area. It also includes other types of non-spatial data such as address points, relationships between features and metadata.
Geospatial Analytics is the process of using GIS data to generate insights into a particular area. It is an important tool for decision makers in a variety of fields including urban planning, public health and business analytics. In Geospatial Analytics, the GIS data is analyzed to uncover trends and patterns in the area being studied. The findings from geospatial analysis can then be used to create more efficient solutions for businesses or guide policy decisions for government agencies.
Geospatial analytics uses advanced software such as Python in conjunction with specialized libraries like geopandas to blend GIS datasets and perform powerful spatial analysis. This software makes it easy to visualize complex trends within GIS datasets with interactive maps, graphs and charts. Data can be further explored with advanced analytics techniques like machine learning to predict future outcomes for areas being studied. With geospatial analysis, professionals have better tools than ever before to solve big problems using accurate geographic information systems data.
Geospatial Visualization in 2023
Geospatial visualization is an important tool for analyzing and interpreting data related to a geographic area. This method of data analysis involves using software programs like Python, analytics, and visualization tools to construct detailed visuals of the physical characteristics within a given region. By creating digital maps, researchers can gain insight into the patterns of population density, land use, environmental features, natural resources, and other data parameters in an area. By leveraging such information within industry sectors such as agriculture, transportation & logistics, healthcare services, manufacturing operations â businesses can better plan for future operations with accurate insights into their surrounding environments.
Using geospatial visualization allows stakeholders to examine different types of data on a granular level such as weather disturbances, disease outbreaks among agricultural products or asset management. With this approach it is possible to represent fields in subtle color gradations against other features that may lend understanding towards more acutely targeted explanations. Visualizing geospatial data also enables researchers to identify key patterns and correlations between geographic features and targeted progress points across large areas or even worldwide regions.
TOP tools for visualization of your GIS Data
- Kepler.gl
- BatchGeo
- ArcGIS Online
- CARTO
- GRASS GIS
- QGIS
- GeoDa
- Geocodio
Geospatial Data Sources
Geospatial data, also known as geographic information or spatial data, is a highly structured form of data used to represent real-world physical and cultural features on a two- and three-dimensional map. It includes the coordinates of points, lines and areas; attributes about the features; relationships between them; and geometric arrangements for efficient visualization of large data sets.
Use this links to find digital geospatial data sites.Â
Primary Sources of FREE USGS Geospatial Data
- The National Map â Go to The National Map Download Client to download US Topo and historical topographic maps, and data for the United States for various themes to include:
1) Boundaries;
2) Elevation Products (3DEP);
3) Elevation Source Data (3DEP);
4) Hydrography (NHD) and Watersheds (WBD);
5) Imagery from High Resolution Orthoimagery and National Agriculture Imagery Program;
6) Map Indices;
7) Geographic Names;
8) Land Cover;
9) Structures;
10) Transportation;
11) Woodland.
Contours are under Elevation Products, and lidar point clouds are under Elevation Source Data.- Small-scale data, formerly on The National Atlas, includes Printable Maps, Small-scale Framework data, and Global Map data (1:1,000,000 scale).
- The National Map Services provide a complete list of service endpoints, which contain REST, WMS, WMTS (cached base maps only), WFS, WCS, and other service links.
- Earth Explorer*- Download data from more than 300 data collections that span over 75 years of coverage. Includes USGS satellite imagery, historical and recent USGS aerial photography, elevation data, land cover products, Lidar point cloud data, Digital Line Graphs (DLGs), Digital Orthophoto Quads (DOQs), and much more. How to use Landsat Spectral Bands can be helpful.
- GloVis*- Just looking for satellite imagery? Donât really need a robust and complex search engine? GloVis is a browse-based viewer thatâs easier to search and more user-friendly than EarthExplorer. Products include Landsat, ASTER, EO-1, MODIS, and TerraLook imagery, NAPP and NHAPimagery. How to use Landsat Spectral Bands can be helpful.
Additional FREE Geospatial Data from the USGS & Our Partners
- LandsatLook*-Full-resolution JPEGs of Landsat satellite images that are best used for image selection and simple visual interpretation. Available as thermal or natural color images with optional geographic reference. Not recommended for digital analysis.
- Emergency Response Portal*-Geospatial imagery for national and international disasters.
- Science Data Catalog*-Metadata and links to all USGS data. Search capabilities are somewhat limited due to the size of certain datasets.
- National Geologic Map Database-Search over 90,000 maps and reports, including free digital maps and GIS map data. Primary themes are geology, geophysics, marine, energy resources, and natural hazards.
- Hazards Data Distribution System (HDDS)*-A dynamic online map interface that can be used to view and download USGS datasets for national or international disasters including floods, hurricanes, tsunamis, and earthquakes.
- Water Spatial Data-Maps and GIS data for water related topics such as water use maps and data, watershed boundaries, NHD, streamflow records, and more.
- Quaternary Fault and Fold Database of the United Statesâ Geologic, geomorphic, and geographic information for over 2,000 Quaternary (active in the last 1,600,000 years) faults in the U.S. Download shape files and Google Earth files.
- Mineral Resources On-Line Spatial Data*- A source for regional and global geology, geochemistry, geophysics, and mineral resource maps and data. Includes map services.
- Global Mineral Resource Assessments*- Most of these reports contain GIS data. The USGS is in the process of compiling all the data in a single location, but for now users must review each link.
- Energy Data Finder*- Geospatial data related to oil & gas, coal, geochemistry, and geophysics. This is also a good place to look for base data in international locations (used in global energy assessments).
- Maps of Americaâs Submerged Landsâ A portal to published USGS maps, reports, and digital data that depict the bathymetry, surficial geology, and/or subsurface structure of selected submerged U.S. areas. This is mostly coastal locations, but some lakes are included.
- Coastal & Marine Interactive Map Serverâ GIS data and metadata for past and current projects.
- Astrogeology MCTR GIS Labâ Graphical, statistical, and spatial GIS tools for analyses of planetary data. All downloads are free. Links to Interactive GIS maps of Mars, the Moon, and Venus.
Geospatial data comes in a variety of forms. Traditional sources include aerial photography, satellite imagery, paper maps and census records. Modern geospatial technologies increasingly use ever larger datasets collected through sensors ranging from GPS systems to mobile phones to automated vehicle Recognition (AVR) systems.
The rise in geospatial technology has drastically increased the availability and sophistication of geospatial datasets from both public sector (e.g., government) sources as well as an exploding number of private sector organizations actively collecting their own location-based commercial data (e.g., web traffic). Consequently, most sectors now rely on geospatial technology solutions including navigation systems, environmental monitoring systems, analytics engines and visualization software applications such as Pythonâs geopandas library for geographic analytics or QGIS for visualization tasks.
By understanding its sources and capabilities, businesses can leverage the power of geospatial technology to optimize product delivery updates , enable customer targeting programs based on locationarlytics , offer engagement mobile solutions (like Walmart Inc.âs Walmart Pay system), or improve their disaster risk management programs .
Challenges of Working with Geospatial Data
The use of GIS data has become increasingly popular in recent years; it provides a powerful tool for analyzing spatial data related to locations and activities. However, working with large datasets of this type can pose a challenge. Geospatial data often has different formats and fields than other types of information, and some users lack the technical skills or resources required to understand and work with them efficiently.
Python is an excellent programming language for handling geospatial data, as it is designed specifically for manipulating such large amounts of spatial information. Geoprocessing tools available in Python provide an effective means of manipulating geospatial data, enabling the user to format the data correctly, filter it according to different criteria and complete analytics tasks quickly.
Geoanalytics refers to using geospatial technology to create actionable insights from location-based data. Advanced analytics tools can be used to explore patterns within geo-data sets and identify trends across varying spatial dimensions. For instance, businesses can use geo-analytics software to gain insights into customersâ purchasing habits by analyzing location information gathered from sales transactions.
Visualization is also a fundamental part of working with geospatial data. By plotting the results from geo-analytics on a map, users can gain valuable insights into their datasets that would otherwise be difficult or time-consuming to uncover within the raw numbers or text alone. Whether using existing visualization tools such as ArcGIS Story Maps or building custom maps using GeoJSON files, visualizing your results brings your analysis process full circle.
Despite its complexities and differences from other forms of datasets, working with geospatial information can open up new opportunities for businesses when used correctly in combination with analytics and visualization techniques. Understanding the challenges associated with this type of data is key to maximizing its potential benefits for any organization looking maximize results from their location-based studies.
Conclusion
Geospatial data is a specialized type of data representing information related to our planetâs physical locations. It can include variables such as latitude, longitude, terrain elevation, and population density, among many others. These complex datasets are used in activities such as mapping and analytics to analyze different patterns and trends across the world. Geospatial data offer key insights in order to answer complex geographical questions and figure out the best ways to use physical space for a variety of applications.
Python is one of the most popular programming languages for working with geospatial data due to its wide range of tools available for importing, manipulating, and visualizing this type of data. Furthermore, Pythonâs libraries make it easy to create powerful analytics dashboards or interactive maps with dynamic features. Additionally, geospatial data visualization has become an essential tool for presentations in recent years as it enables communicators to more easily understand patterns in large datasets and key pieces of information when it comes to making decisions related to land management or policy initiatives.
In conclusion, geospatial data is critical for businesses seeking geographic insight into their activities or operations when developing products or making strategic decisions. With the range of open source libraries available that enable easy manipulation of this type of information using Python coding language skillsets have become highly sought after professionals across many industries today.
How Geolocation Technology Works in Online Dating Around the World
Quite like everything else, online dating has changed considerably over the last few years. It has evolved with new and advanced technologies being utilized to fetch the finest matches. Along with some old-school dating sites, it is now so easy to find an influx of newer social dating sites that rely on new technologies to bring people closer. Top dating sites now use advanced search filters to provide their members with exactly what they are looking for. And a recent step in making those matches even more exciting is to search for a partner in your local area.Â
Viewed from a distance, the city becomes a map that can be read, understood and interpreted like a text.
Kristin Veel
How Location-Based Technology Is Implemented in the Dating Industry
Geolocation has helped online dating become a lot more exciting and accurate. Besides finding partners in your local area, you can pick a person from any geographical location. If you are interested in interracial dating and specifically want an Asian girl hookup, location-based technologies always help. Of course, basic search filters on interracial dating sites help you find Asian or Chinese girls in your own country or region, but geolocation and geotagging facilitate the whole process and add more accuracy to it.Â
Finding someone from China or another part of the world while sitting in the US would be very difficult without geolocation. Now, if you are planning a visit to Japan, Korea, or any other country, simply use Geolocation features and identify the list of Asian members on any platform.
Speaking of implementation of geo-location features, many dating sites let their members decide. They give them the chance to reveal or conceal their geographical location and use it as a way to connect with others in the same area. Of course, it raises questions about personal security and ways to keep stalkers at bay, and more people are comfortable sharing their location because they feel it leads to more real-life connections. It is also evident from the fact that newer geolocation apps are being introduced daily.Â
Newer dating websites now offer Android and iOS apps, and all a user needs to do is download them and let them access their location. However, the accuracy of your location often varies from site to site, as some may only share details about your city, while others would mention your town or even street address. Ultimately, it is up to you to decide how far you want to go using geolocation features, as they may feel a bit intrusive to some.
Geolocation Increases the Matchmaking Rate of Casual Dating
The fear of alerting people about your location is quite real, but new and improved dating sites now let you take charge of everything. With new software solutions being used, it is much safer to use your geographical location to find others who are not far from you and also look for casual hookups nearby. New dating site apps now come with a built-in flagging feature, which tells you about any inappropriate contact and helps you maintain your safety.Â
Other dating sites offer private chat and private blog access to connect with people they want to date. It means that not only do geolocation features serve great as matching techniques, but they also play a part as warranting techniques to help you decide whether a profile seems trustworthy or not.Â
Dating Categories and Search Filters by Location
Online dating sites are extremely useful because they provide you with hundreds of potential suitors under one roof. Advanced filters are now available along with basic ones, such as body type, gender, age, hair color, and more. They work flawlessly and help you find Asian singles, Chinese singles, and dating partners from other parts of the world. You can also search, for example, for Asian singles who are non-smokers and value fitness more than anything. It is even possible to find dating partners based on your fetish.Â
All these filters are popular, but finding partners by location is all the rage now and the top of the chart are singles from Asian countries, as foreigners find them pretty, cute, and mystical. Knowing that someone is in your area conveys that you are meeting someone who shares the same interests and visits the same places you like in your area, making matchmaking a breeze. It is all about meeting a âfamiliar strangerâ who is likely to have the same set of experiences as you have.Â
Monetizing Geography with Local Advertising
Disclosing your location may feel frightening at times, but it also has other benefits. Being able to find a dating partner in your area sounds awesome, but you may also benefit from local advertising. You may get additional information about dating events in your area or new places where you can hang out with your partner. Other than dating sites, other businesses also utilize geolocation features to sell specific products to people from specific regions. The online dating industry benefits from geo-targeting just as much as users do, so location-based technology plays both ways in that sense.
Geolocation features are becoming popular because they offer many benefits. Every business can benefit from these features, but dating sites are the front-runners in this regard. Finding a partner in your area means you can arrange a date in no time, making casual dating a lot more interesting and exciting.
All You Need to Know About Geofencing Apps
What is geofencing? The origins of this technology go back as far as the 1960s. Geofencing is in cahoots with Global Positioning System (GPS) first developed for the American NAVY. Commercially used, geofencing is tightly associated with the so-called Proximity Marketing. The latter is applied when companies generate SMS messages based on the location of potential clients to boost sales as well as to promote discounts and clearings.Â
What about nowadays? Thereâs a million and 1 use for geofencing applications. Letâs get organized and follow through on the usage and usefulness of this technology in modern-day software development and business optimization.Â
What is Geofencing and How Does it Work?
Geofences are geo-boundaries or virtual borders. It is, in its essence, a software product feature able to send a response when a marked mobile device leaves or enters a certain place. Different geofencing applications get connected through RFID, Wi-Fi, GPS, and cellular networks. When a tagged device moves outside the mapped area a signal is sent to indicate that movement took place.Â
The functionality features are made with software and require no additional hardware other than location-aware mobile devices. Such are GPS microchips that are embedded in smartphones, iPads, and sometimes laptops.Â
How is that useful? Well, imagine walking into a supermarket. While you are there, you receive SMS or in-app notification that a certain store offers a significant purchase discount today right around the corner. This is useful for the owner of a store (increases in sales and shop visitors) and it is also very convenient for clients who become aware of the most important clearances right in time where they might consider making a purchase.  Â
Proximity marketing allows targeting potential clients and existing customers by ZIP code, neighborhood, and city. More importantly, geofencing apps allow targeting people by specific buildings they enter (as is in the case with a supermarket described above).Â
Google Earth Maps can be used to define a certain area in a geofencing app. Or the data integrated into the app can be as simple as a certain radius around a chosen point. This perimeter with coordinates is then tied to a user/group of users.Â
Another popular use of geofencing apps is to monitor and track the movement of pets, children, elderly users, and people with disabilities to signal when they leave a designated area. Some hazardous areas can be geofenced and anybody who enters will receive a notification to be cautious, rerouting people away from potentially harmful incidents. There are countless possibilities and geofencing apps can even make it possible to target the clients of your competitors.Â
Delivery services can use geofencing to send messages to smartphones operating in the radius where they deliver food or other goods.
Hereâs a potential list of the industry niches that can benefit from geofencing apps and not only via SMS messages:
- Property ManagementÂ
- Human ResourcesÂ
- Property SecurityÂ
- Real EstateÂ
- TransportationÂ
- Retail CommerceÂ
- Delivery
Real-time Geofencing Visualization Â
It is important for users of any geofencing app to be in total control. Therefore, back-end functionality might properly appear and be arranged visually with clever UI, allowing to monitor whatâs happening on the defined premises in real-time. That is the most important thing.Â
Once a potential customer leaves the supermarket, it is no longer of use to know heâs been here âcause heâs already gone, right? So, users should be able to change the radius (10 miles, 20 miles) or switch between the different perimeters (retail store X in supermarket Y, retail store Z in supermarket A, coffee shop B on block C).  Â
Gathering Data to Define Geofencing Radius
In order to start you should pick the exact coordinates. Nevertheless, you need to establish a connection with users who enter in advance. For example, Walmart clients give away their phone numbers in a customer survey or to get a discount card. Their phone numbers are then added to a database. Then, whenever they enter a Walmart they receive (it can even be personalized) a notification, for example, â50% off toys clearance at the aisle 17â.Â
Geofencing apps can be much more complex with layers of additional functionality on top of the basic features. Keep in mind to consider privacy issues, since modern users have become completely aware of how their data is distributed.Â
It is essential to make sure that you use the data properly and not only for the advantage of your business but to make your client more comfortable and save their time as well. Be reasonable and responsible. Â
Difference Between Geofencing and GeolocationÂ
Geolocation is tracking and is primarily related to a certain database of exact devices. Using geolocation, you track devices. Using geofencing, you track the location itself and âguardâ the perimeters, identifying anybody who is âtrespassingâ. When you use geolocation, you know wherever a device is going. When you use geofencing, you know whoever is entering a predefined location.Â
Aisle-by-Aisle Heat Maps in RetailÂ
Can you imagine geofencing tech so precise that is able to show how much people stop at and move along certain aisles in a supermarket? Well, no need to imagine it now. Cunning marketers at Walmart and elsewhere have already made it a reality. This is, perhaps, one of the greatest attempts at consumer research.Â
Getting Your Product and Services NoticedÂ
If geofencing wasnât so effective, it wouldnât be so widely used by major retailers and a myriad of other businesses across the globe.Â
Geofencing apps are rapidly improving technology. Constantly updates Google Maps allow for a more precise perimeter targeting. User privacy regulations set boundaries, so even if you own the property, it doesnât mean you can always send SMS or app notifications to any user who sets foot on the geofenced territory.Â
Nevertheless, most of the user data online are available and widely distributed, so if you have some 1000 or 100 000 contacts, your app may detect them and send a notification once they are on the defined territory. But the technology can be applied in a wider range of ways beyond sophisticated market schemes. Â
Without any doubt, geofencing is very advanced technology has the ability to both improve your business and make users more aware of their surroundings. I would gladly give my location data away to know what happens around me, where can I get a cup of good coffee and whoever informs me earlier than I google it, has me as their client.